How to plot temperature results in IES using Python

This post looks at how to use Python to plot temperature data results from an IES building model.
What is this?
- An IES Python script has been developed.
- This can be downloaded from the web and then uploaded to the IES software.
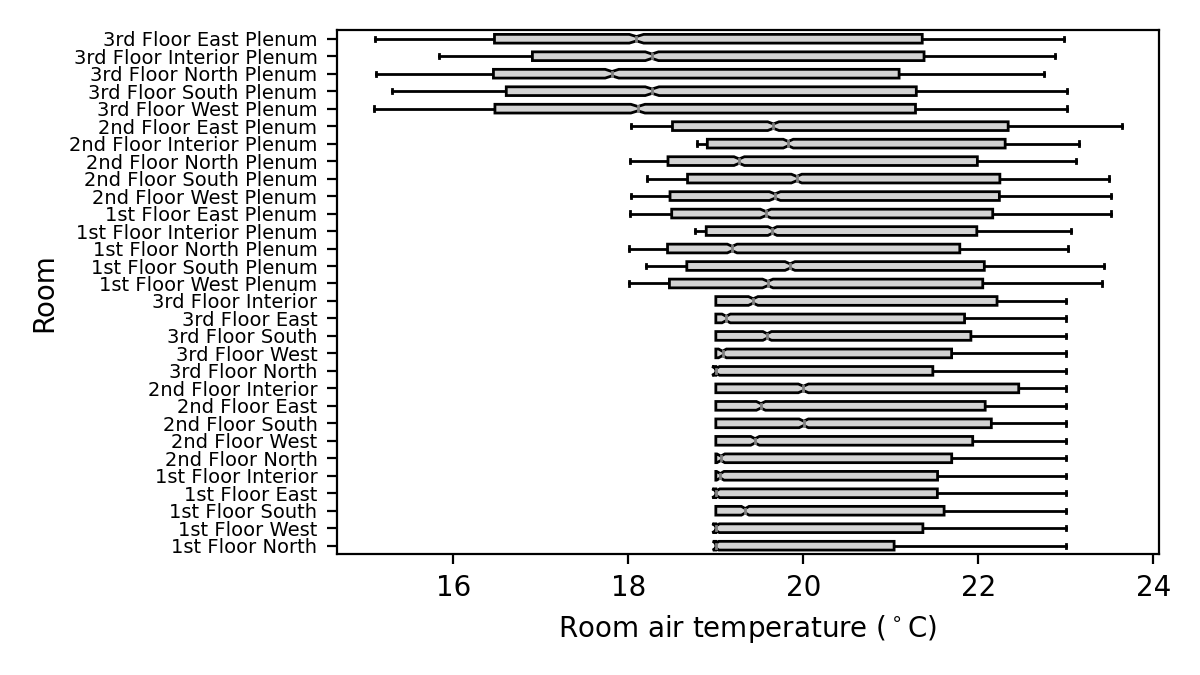
- The Python script will create a horizontal boxplot of the hourly room air temperature results for all rooms in a building model (see the main figure of this blog post).
Can I get the Python script?
Yes, it is available for download here.
See this blog post for how to install the script in your IES installation.
How does it work?
The Python script has 5 steps.
Step 1 - Setup
As well as importing a number of standard Python packages, this step imports the iesve module which allows us to interact with the IES model itself.
import iesve
current_project = iesve.VEProject.get_current_project()
dir_current_project = current_project.path.replace('\\','/')
dir_vista = os.path.join(dir_current_project, 'vista')
Excerpt from the Python script, Step 1 - Setup
Step 2 - Select results file
The IES results file (.aps file) to be used is selected using a open file dialog box, a part of the Tkinter Python package.
root = Tk()
root.withdraw()
fp_in = askopenfilename(title = 'Select IES results file', parent = root, initialdir = dir_vista, filetypes = [("APS files","*.aps")])
root.destroy()
Excerpt from the Python script, Step 2 - Select results file
Step 3 - Get room data
Information on the rooms in an IES model is available via the body objects. This step creates a dictionary with the room data for all rooms in the IES model.
realmodel = current_project.models[0]
bodies = realmodel.get_bodies(False)  # False means get all bodies
room_data_dict = {body.id: body.get_room_data().get_general() for body in bodies}
Excerpt from the Python script, Step 3 - Get room data
Step 4 - Load temperature data
The results data is accessed via the ResultsReader class. This step creates a dictionary with the hourly room air temperature results for all rooms in the IES model.
with iesve.ResultsReader.open(fp_in) as f:
    air_temperatures_dict = {
        room_id: f.get_room_results(room_id, 'Room air temperature', 'Air temperature', 'z')
        for room_id in f.get_room_ids()
        }
Excerpt from the Python script, Step 4 - Load temperature data
Step 5 - Plot figure
Matplotlib is used to create the final figure.
fig, ax = plt.subplots(
    figsize = (
        6,
        min(0.4 * len(room_data_dict), 4)  # increase height of plot based on number of rooms
        ),
    dpi = 200
    )
ax.boxplot(
    air_temperatures_dict.values(),
    vert = False,
    notch = True,
    patch_artist = True,  # to enable box facecolor editing
    labels = [room_data_dict[x]['name'] for x in air_temperatures_dict.keys()],  # converts room ids to room names
    boxprops={'facecolor': 'lightgrey'},
    flierprops={'marker': '.', 'markersize': 1, 'markerfacecolor': 'grey', 'markeredgecolor': 'grey'},
    medianprops={'color': 'grey'}
    )
ax.set_ylabel('Room')
ax.set_xlabel('Room air temperature ($^\circ$C)')
ax.yaxis.set_tick_params(labelsize=10 - len(room_data_dict) * 3 / 30)    # reduces room name font size based on nmber of rooms
fig.tight_layout()
plt.show()
Excerpt from the Python script, Step 5 - Plot figure
The code above can be modified to alter the appearance of the final figure.
Below is an example of the figure generated by the Python script for the Small Office IES starter geometry building.
Next steps
- For more information on using Python with IES, please see this post.
- View the IES technical documentation on its Python API here.
- Any issues please let me know. I will update the Python script file on GitHub as needed.
- Any requests for other Python scripts for IES? Please contact me.